Monitoring multiple Substrate nodes (Polkadot, Kusama, parachains) 2023
In the previous article, we’ve seen how to setup a monitoring and alerting system on a single validator/collator node. At the time I wrote this, parachains were not even launched yet. This solution is secure and easy to set up but has several drawbacks, especially: no alerting in case of instance down, need to be connected to SSH to access the dashboard, and multi nodes management that requires installing the whole stack on each server (using a dedicated server for each validator/collator is an obviousness for everyone right?).
In this guide, we will learn to set the following stack for full multi nodes monitoring (alerting will be the topic for another article).
This will require a dedicated server for the monitoring stack but don’t be afraid: it consumes a minimum amount of resources and can easily be set up on a cheap VPS.
This guide sets up the brand new dashboard 16863, please consider giving it a review on Grafana website to make it more visible to others.
General understanding
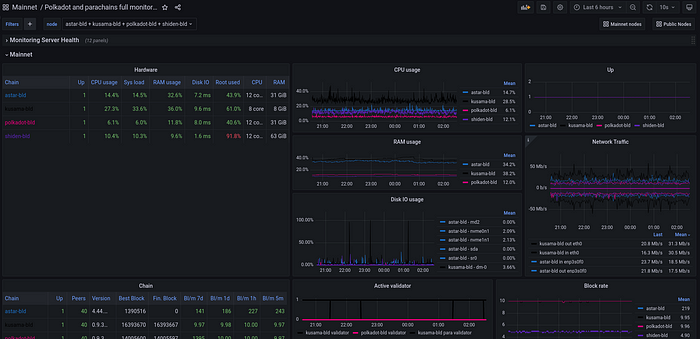
Here is how our configuration will look like at the end of this guide

Multi nodes monitoring stack (all open source based)
- All tools are managed on a dedicated monitoring instances
- Metrics are scraped through a Wireguard secure VPN installed on both sides.
- Prometheus is the central module; it pulls metrics from different sources to provide them to the Grafana dashboard.
- Grafana is the visual dashboard tool that we access to via https. Since the v8, it also manages alerts (no need for alert manager anymore)
- Nginx is the web server that allows to connect to Grafana dashboard. It is also possible not to install it and connect to Grafana via SSH tunnel.
This solution is quite elegant because it keeps the nodes secure with a private owned VPN that avoids exposing the prometheus ports externally.
For the monitoring instance, you do not need a powerful machine at all, a cheap VPS works like a charm. WireGuard is working at network layer 3 level through UDP protocol, making it very light and efficient.
Monitoring server configuration
Let’s start by the monitoring server stack installation and configuration.
Before starting the process, it never hurts to upgrade packages
sudo apt-get update && sudo apt-get upgrade
sudo apt install -y adduser libfontconfig1
Private IP assignation
To make node servers communicate with the monitoring server, you will need to assign manually a block of private IP addresses within one of the following ranges:
10.0.0.0to10.255.255.255(10/8)172.16.0.0to172.31.255.255(172.16/12)192.168.0.0to192.168.255.255(192.168/16)
For this guide, we will use the block 172.16.0.1/12.but you can pick another one if you already use this range.
The configuration of these addresses will be detailed in the Wireguard part.
Prometheus
Prometheus will pull metrics from different nodes and store data in its time series database, that you will be able to exploit later with Grafana.
Get the latest version of Prometheus:
wget $(curl -s https://api.github.com/repos/prometheus/prometheus/releases/latest |grep "tag_name" | awk '{print "https://github.com/prometheus/prometheus/releases/download/" substr($2, 2, length($2)-3) "/prometheus-" substr($2, 3, length($2)-4) ".linux-amd64.tar.gz"}')
Extract and copy files:
tar xvf prometheus-*.tar.gz
sudo cp ./prometheus-*.linux-amd64/prometheus /usr/local/bin/
sudo cp ./prometheus-*.linux-amd64/promtool /usr/local/bin/
sudo cp -r ./prometheus-*.linux-amd64/consoles /etc/prometheus
sudo cp -r ./prometheus-*.linux-amd64/console_libraries /etc/prometheus
Create dedicated user and directory:
sudo useradd --no-create-home --shell /usr/sbin/nologin prometheus
sudo mkdir /var/lib/prometheus
Change the ownership of directories:
sudo chown -R prometheus:prometheus /etc/prometheus/ /var/lib/prometheus/
Clean up the download directory:
rm -rf ./prometheus*
Edit the Prometheus config file
sudo nano /etc/prometheus/prometheus.yml
Add the following block at the start of the file, this is general Prometheus config and we add node exporter (which will be installed later) to also monitor our monitoring instance:
global:
  scrape_interval: 15s
  evaluation_interval: 15s

scrape_configs:
  - job_name: "prometheus"
    scrape_interval: 5s
    static_configs:
      - targets: ["localhost:9090"]
  - job_name: "node_exporter"
    scrape_interval: 5s
    static_configs:
      - targets: ["localhost:9100"]
The second part of the file is where you will assign private IP addresses to you nodes:
- job_name: "mainnet"
    scrape_interval: 5s
    static_configs:
      - targets: ["172.16.0.10:9615","172.16.0.10:9100"]
        labels:
          chain: 'kusama'
      - targets: ["172.16.0.11:9615","172.16.0.11:9100"]
        labels:
          chain: 'astar'
job_namegroups all mainnet nodes into one job. Do not change this name, it is used by the Grafana dashobard.targetsfor each mainnet node, assign manually a private IP and scrap data from port9615(blockchain node metrics) and9100(node exporter hardware metrics). It is recommended to start atx.x.x.10and assign sequentially.labelset a customchainlabel for each node to scrap.
In this example, we will monitor a Kusama and an Astar node.
Note : you have to create a new
targetsblock for each node you want to monitor.
As you are a good validator/collator, you also maintain a backup for each node you run. In this case, create a backup job below the mainnet one:
- job_name: "backup"
    scrape_interval: 5s
    static_configs:
      - targets: ["172.16.1.10:9615","172.16.1.10:9100"]
        labels:
          chain: 'kusama-backup'
      - targets: ["172.16.1.11:9615","172.16.0.11:9100"]
        labels:
          chain: 'astar-backup'
In this example, we have assigned the backups address 172.16.1.xxto differentiate them easily.
Check the Prometheus config file:
promtool check config /etc/prometheus/prometheus.yml
Create the Prometheus service file:
sudo nano /etc/systemd/system/prometheus.service
Add the following lines:
[Unit]
  Description=Prometheus Monitoring
  Wants=network-online.target
  After=network-online.target

[Service]
  User=prometheus
  Group=prometheus
  Type=simple
  ExecStart=/usr/local/bin/prometheus \
  --config.file /etc/prometheus/prometheus.yml \
  --storage.tsdb.path /var/lib/prometheus/ \
  --web.console.templates=/etc/prometheus/consoles \
  --web.console.libraries=/etc/prometheus/console_libraries
  --storage.tsdb.retention.time 30d \
  --web.enable-admin-api

  ExecReload=/bin/kill -HUP $MAINPID

[Install]
  WantedBy=multi-user.target
In this file, we have added 2 parameters to the reference command:
storage.tsdb.retention.timesets the retention time to 30 days, this is useful for analysis and not consuming a lot of storage.web.enable-adin-apienables web admin api which will allow us to delete a serie of data through an API call, this is useful in some cases.
Send daemon reload to take the services into account in systemdand start it:
sudo systemctl daemon-reload
sudo systemctl start prometheus.service
Verify the service and enable it:
systemctl status prometheus.service
sudo systemctl enable prometheus.service
Node Exporter
We want to monitor our monitoring instance hardware to make sure it is always running fine. We will do this with Node Exporter.
Get the latest version of Node Exporter:
wget $(curl -s https://api.github.com/repos/prometheus/node_exporter/releases/latest |grep "tag_name" | awk '{print "https://github.com/prometheus/node_exporter/releases/download/" substr($2, 2, length($2)-3) "/node_exporter-" substr($2, 3, length($2)-4) ".linux-amd64.tar.gz"}')
Extract and copy files:
tar xvf node_exporter-*.tar.gz
sudo cp ./node_exporter-*.linux-amd64/node_exporter /usr/local/bin/
Create dedicated user:
sudo useradd --no-create-home --shell /usr/sbin/nologin node_exporter
Clean up the download directory:
rm -rf ./node_exporter*
Create the Node exporter service file:
sudo nano /etc/systemd/system/node_exporter.service
Add the following lines:
[Unit]
  Description=Node Exporter
  Wants=network-online.target
  After=network-online.target

[Service]
  User=node_exporter
  Group=node_exporter
  Type=simple
  ExecStart=/usr/local/bin/node_exporter

[Install]
  WantedBy=multi-user.target
Send daemon reload to take the services into account in systemdand start it:
sudo systemctl daemon-reload
sudo systemctl start node_exporter.service
Verify the service and enable it:
systemctl status node_exporter.service
sudo systemctl enable node_exporter.service
Wireguard
On the monitoring server side, we will configure Wireguard as the host of the private network.
If you want to know more about Wireguard configuration, you can refer to this guide. Here, we are not going to use it to route the internet traffic but only to communicate with the blockchain node servers.
Install the package:
sudo apt-get install wireguard
Generate the VPN private and public keys:
umask 077

### {MONITORING_SERVER_PRIVATE_KEY} ###
wg genkey | sudo tee /etc/wireguard/private.key

### {MONITORING_SERVER_PUBLIC_KEY} ###
sudo cat /etc/wireguard/private.key | wg pubkey | sudo tee /etc/wireguard/public.key
To make it easy, we refer to these keys as {MONITORING_SERVER_PRIVATE_KEY}and{MONITORING_SERVER_PUBLIC_KEY}.
Note: save the public key here, it will be used for nodes configuration.
Create the Wireguard config file:
sudo nano /etc/wireguard/wg0.conf
Add the following lines:
[Interface]
Address = 172.16.0.1/12
SaveConfig = true
ListenPort = 51100
PrivateKey = {MONITORING_SERVER_PRIVATE_KEY}
Address: define the address of the server, use the 1st address of the range defined previously.ListenPort: port where peers (nodes) will connect to. This port needs to be open in the firewall.PrivateKey: generated just before
If you are using ufw firewall, you need to allow the interface wg0 and the listen port:
sudo ufw allow in on wg0 to any
sudo ufw allow 51100
Start the service:
sudo systemctl start wg-quick@wg0
We will come back later to the VPN, once the nodes have set their own.
Grafana
For the moment, we will just proceed with the installation.
Get the latest version of Grafana:
wget $(curl -s https://api.github.com/repos/grafana/grafana/releases/latest |grep "tag_name" | awk '{print "https://dl.grafana.com/oss/release/grafana_" substr($2, 3, length($2)-4) "_amd64.deb"}')
Install the package:
sudo dpkg -i grafana*.deb
Clean up the download directory:
rm -rf ./grafana*
Start the service:
sudo systemctl start grafana-server
Verify the service and enable it:
systemctl status grafana-server
sudo systemctl enable grafana-server
Nginx
A Nginx server is very convenient to access your Grafana from anywhere. We will set here a sub domain name where Nginx will proxy the Grafana server but if you don’t own a domain name, you still can use the server IP address instead in the next steps.
Note : the configuration below is provided with the example subdomain
grafana.bldnodes.org. Of course, you need to change this.
First, we need to create an A record for sub domain name in our DNS provider that we point to our monitoring server IP:

Install Nginx and Certbot:
sudo apt-get install nginx snapd
sudo snap install core; sudo snap refresh core
sudo snap install --classic certbot
sudo ln -s /snap/bin/certbot /usr/bin/certbot
Before continuing, you need to open ports 80 (http) and 443 (https) in your firewall. I you use ufw firewall:
sudo ufw allow 80
sudo ufw allow 443
Create an nginx file for the sub domain:
sudo touch /etc/nginx/sites-available/grafana.bldnodes.org && sudo ln -s /etc/nginx/sites-available/grafana.bldnodes.org /etc/nginx/sites-enabled/
sudo nano /etc/nginx/sites-available/grafana.bldnodes.org
Add the following lines:
server {
  listen 80;
  listen [::]:80;
  root /var/www/grafana.bldnodes.org/html;
  index index.html index.htm index.nginx-debian.html;
  server_name grafana.bldnodes.org;
  location / {
    try_files $uri $uri/ =404;
  }
}
Check the config and restart nginx:
sudo nginx -t
sudo systemctl restart nginx
Issue certificate with certbot:
sudo certbot — nginx -d grafana.bldnodes.org
Change the nginx file to allow https only
sudo nano /etc/nginx/sites-available/grafana.bldnodes.org
Replace with the following lines:
map $http_upgrade $connection_upgrade {
    default upgrade;
    '' close;
}server {
  # SSL configuration
  listen 443 ssl;
  listen [::]:443 ssl;  root /var/www/grafana.bldnodes.org/html;
  server_name grafana.bldnodes.org;  ssl_certificate /etc/letsencrypt/live/grafana.bldnodes.org/fullchain.pem; # managed by Certbot
  ssl_certificate_key /etc/letsencrypt/live/grafana.bldnodes.org/privkey.pem; # managed by Certbot
  ssl_session_timeout 5m;
  ssl_protocols SSLv2 SSLv3 TLSv1 TLSv1.1 TLSv1.2;
  ssl_ciphers   HIGH:!aNULL:!MD5;
  ssl_prefer_server_ciphers on;  location / {
    # Proxy Grafana to sub domain
    proxy_pass http://localhost:3000;
    proxy_pass_request_headers on;
    proxy_http_version 1.1;
    proxy_set_header Host $host;
    proxy_set_header X-Real-IP $remote_addr;
    proxy_set_header X-Forwarded-For $proxy_add_x_forwarded_for;
    proxy_set_header Upgrade $http_upgrade;
    proxy_set_header Connection $connection_upgrade;
  }
}
Check the config and restart nginx:
sudo nginx -t
sudo systemctl restart nginx
systemctl status nginx
If everything went fine, you should see a result like that:

Check access
If Grafana and Nginx have been configured correctly, you should be able to access Grafana in your browser: https://grafana.bldnodes.org
You made it until there? You did the longest part, here comes the repetitive but lighter one.
Node servers configuration
Node update
Add this command to the node service file and restart
--prometheus-external
The node will start sending chain metrics on the port 9615.
Node exporter
The configuration is exactly the same than the monitoring server one, just refer to this section.
Wireguard
Install the package:
sudo apt-get install wireguard
Generate the VPN private and public keys:
umask 077

### {NODE_PRIVATE_KEY} ###
wg genkey | sudo tee /etc/wireguard/private.key

### {NODE_PUBLIC_KEY} ###
sudo cat /etc/wireguard/private.key | wg pubkey | sudo tee /etc/wireguard/public.key
Here, we refer to these keys as {NODE_PRIVATE_KEY}and{NODE_PUBLIC_KEY}.
Create the Wireguard config file:
sudo nano /etc/wireguard/wg0.conf
Add the following lines:
[Interface]
Address = 172.16.0.10/32
PrivateKey = {NODE_PRIVATE_KEY}

[Peer]
PublicKey = {MONITORING_SERVER_PUBLIC_KEY}
AllowedIPs = 172.16.0.0/30
Endpoint = {MONITORING_SERVER_PUBLIC_IP_ADDRESS}:51100
PersistentKeepalive = 60
Address: private address assigned to this node, with a mask 32AllowedIPs: address range chosen in the beginning, with a mask 30Endpoint: public IP address of the monitoring server, on the port chosen for Wireguard
If you are using ufw firewall, you need to allow the interface wg0 and the listen port:
sudo ufw allow in on wg0 to any
sudo ufw allow 51100
Start the service:
sudo systemctl start wg-quick@wg0
Verify the VPN connectivity
sudo wg
This is all for the node side, but of course you have to repeat this for each node you manage. At some point, you will really consider Ansible as your best friend :)
Finish configuration of the monitoring instance
Wireguard
Once the VPN is set on the node side, get back to the monitoring instance and allow all the nodes public keys to connect, matching their respective IP addresses:
sudo wg set wg0 peer {NODE_PUBLIC_KEY} allowed-ips 172.16.0.10
Verify connectivity
sudo wg
At this point, you should see all the peers (nodes) appearing with a handshake and data exchanged:
interface: wg0
  public key: {MONITORING_SERVER_PUBLIC_KEY}
  private key: (hidden)
  listening port: 45759

peer: {MONITORING_SERVER1_PUBLIC_KEY}
  endpoint: {MONITORING_SERVER1_PUBLIC_IP}
  allowed ips: 172.16.0.10/32
  latest handshake: 7 seconds ago
  transfer: 9.25 MiB received, 416.84 KiB sent

peer: {MONITORING_SERVER2_PUBLIC_KEY}
  endpoint: {MONITORING_SERVER2_PUBLIC_IP}
  allowed ips: 172.16.0.11/32
  latest handshake: 23 seconds ago
  transfer: 8.81 MiB received, 411.82 KiB sent
There is a 80% chance that something is going wrong at the 1st setup, don’t worry this happened to all of us. In this case, take a deep breath, read and check again all the values compared to this guide: it is very frequent to invert private and public key, or monitoring and node one.
Congratulations, you made it!
The last part is just about fun and enjoy.
Grafana finalisation
Access Grafana in your browser: https://grafana.bldnodes.org

Enter the default user admin and password admin then change password.

Open the Settings menu:

Click on Data Sources:
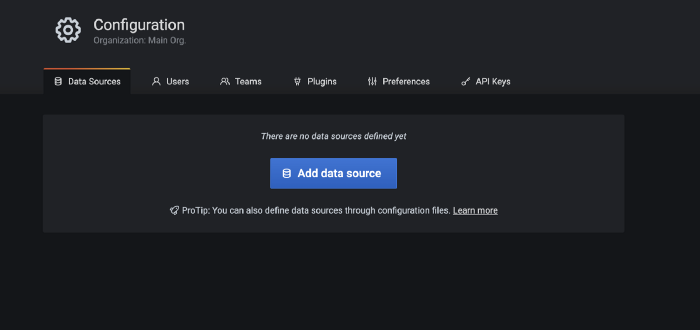
Click on Add data source:

Select Prometheus:

Just fill the URL with http://localhost:9090 and click Save & Test.
Import the dashboard
Open the Dashboard menu:

Click on Import:

Select the top-of-the-line dashboard 16863 (please give it a review there:-)) and click Load:

Select the Prometheus source and click Import.
Easy right? Just think about saving the dashboard once parameters are set and work.

Save dashboard settings locally

Here you are, all you nodes are being monitored in one place!
Conclusion
We learned in this tutorial how to set a fully secure monitoring stack for multiple nodes using only open source software: Wireguard, Prometheus, Node exporter, Grafana and Nginx.
There are many great guides all over the web that will be much more detailed but again, I wanted to provide this one as a ‘all-in-one step-by-step’ solution.
This guide does not cover the alerting part and the log collection part which will be the object of future dedicated guides.
The new dashboard is the result of months of work, constantly updating it to fit the everyday needs of monitoring collator and validator nodes. If you like it, I would love you to post a review on Grafana’s website and more importantly, send me your feedback so that I can improve it.
- Twitter : @bLdNodes
- Matrix : @bld759:matrix.org
- Or open an issue/PR on the Github repo
If you’d like to tip or nominate my validators:
- DOT validator: 12bLdVAgWiKHgFHtAaQstasMUWVq35oG9iwHCwsKoFFNoNrk
- KSM validator: Hf8C626KBAjitMV7w8AhQWDCiPgUU47htEwbomq5mDMKeyL
Validator and collators node service for Polkadot ecosystem blockchains. Security and reliability 1st. https://twitter.com/bLdNodes
0 comments