Discover the Improved Nodle Explorer: Your Guide to Nodle Ecosystem Insights
Introduction
The Nodle Explorer got a major upgrade, making it even better for users to understand what’s happening in the Nodle Ecosystem. In this article, we’ll break down the key changes in the Network and Token views, giving you a clearer picture of the new features.
Enhanced Network View
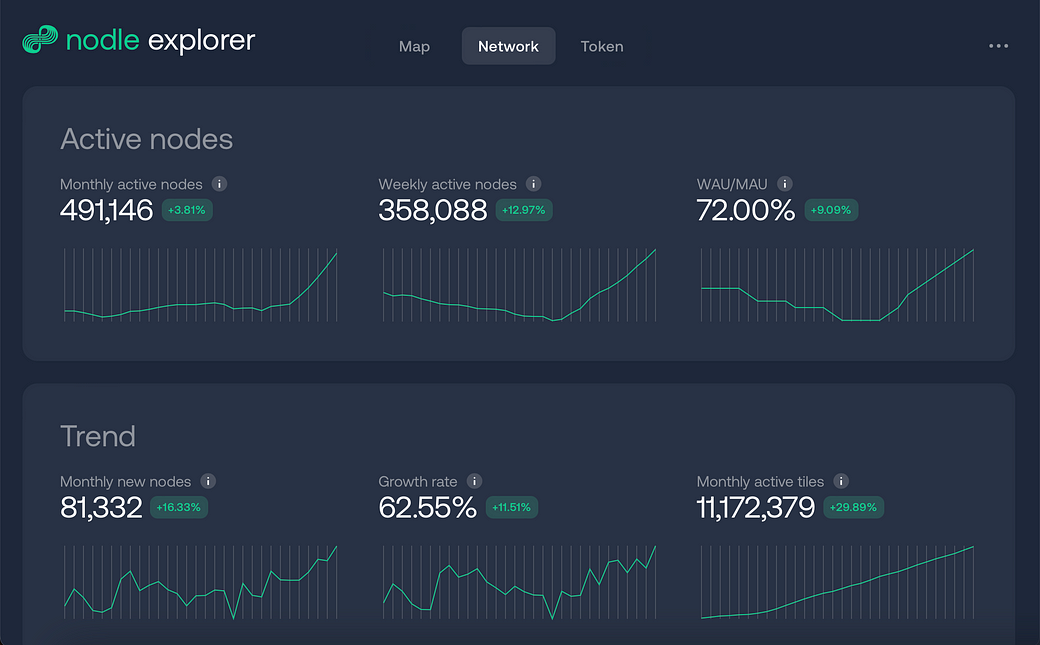
The Network view was simplified by removing the reporting period selector and moving NODL token and Nodle chain metrics to a dedicated Token view. You can now effortlessly check the monthly and weekly active nodes on a single page, eliminating the need to switch between different timeframes.
Additionally, several new metrics were added for enhanced insights into the Nodle network. The WAU/MAU ratio reflects node activity, with proximity to 1 meaning consistent node engagement. Metrics tracking new nodes and monthly active node growth rate provide a clear overview of network dynamics and its expansion rate.
New Token View

The Token View tab has been introduced to consolidate metrics for both the NODL token and the Nodle chain.
In addition to the previously available data such as the NODL token price and the total supply, you can now access information on the token’s circulating and maximum supply. By multiplying these values with the token price, the system calculates and displays key financial metrics such as the market capitalization and fully diluted value (FDV) on the dashboard.
Furthermore, the Explorer uses the total supply of tokens and the daily issuance of NODL to calculate and display the token inflation rate. This provides valuable insights into the token actual stability as opposed to the perception. Remarkably, this inflation rate is lower than the global inflation rates for many fiat currencies.
There is the perception that the Nodle Network rewards “too much” the network participants. In reality, at it currently stands at 3.4% inflation rate per year, this is in line with other networks. The Polkadot network for instance has no maximum supply and has an inflation rate of 10% a year (see reference) with about 7% going to staking rewards. In the case of the Nodle Network, the rewards don’t go to stakers that contribute their tokens, but instead go to network participants that contribute their resources (time and network access).
Chain Activity Metrics

The Token View now includes expanded chain activity metrics, offering a comprehensive overview of various aspects such as the number of token holders, new wallet creations, transfers, and user transactions (excluding rewards) on the Nodle chain.
Additionally, it encompasses NFT metrics, detailing the total number of NFTs minted on the chain, recent NFT minting activity, and the number of NFT transfers.
Convenient Links

For NODL token holders, we have added quick links to the most popular real-time token price tracking platforms and a list of active exchanges have listed the NODL token
Detailed Metric Explanations

Not certain about how a metric is calculated? For each metric on the Explorer, you can find a comprehensive explanation right beside the metric title, denoted by the informative “i” icon.
Conclusion
The redesigned Nodle Explorer serves as your advanced portal to the Nodle Ecosystem, providing streamlined navigation, clear insights, and useful tools. Delve into the Nodle universe with ease and assurance, utilizing the newly implemented features crafted for an improved, user-centric experience
World’s largest ecosystem of connected devices, providing low cost, secure wireless infrastructure + data insights for enterprises, manufactures & smart cities
4 comments